
Last Updated on February 8, 2026 by Rajeev Bagra
Understanding correlation is essential in data analysis, finance, marketing, and business intelligence.
In this tutorial, you will learn:
What Pearson correlation really measures
Why “no correlation” happens
How the formula works
When Pearson fails
How professionals use it in finance
How to interpret graphs correctly
1. What Is Pearson Correlation?
The Pearson Correlation Coefficient (r) measures:
How strongly two variables move together in a straight-line pattern.
Its value lies between:
| Value | Meaning |
|---|---|
| +1 | Perfect positive |
| 0 | No linear relation |
| –1 | Perfect negative |
Example:
- Ads ↑ → Sales ↑ → Positive
- Rates ↑ → Loans ↓ → Negative
2. Important Rule: Pearson Is About X vs Y (Not Time)
Many beginners think:
“If X and Y are both straight over time, they are correlated.”
This is wrong.
Pearson does NOT care about time.
It only looks at:
How Y changes when X changes.
So always think:
Plot Y against X — not against time.
3. The Pearson Formula
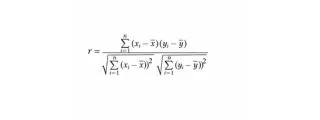
What It Means in Simple Words
Correlation = (How X and Y move together) ÷ (How much they move separately)
4. How the Formula Detects Relationship
The key part is:

This multiplies deviations.| X moves | Y moves | Result |
|---|---|---|
| Up | Up | + |
| Down | Down | + |
| Up | Down | – |
| Down | Up | – |
If many + → Positive r
If many – → Negative r
If + and – cancel → r ≈ 0
That is how “no correlation” appears.
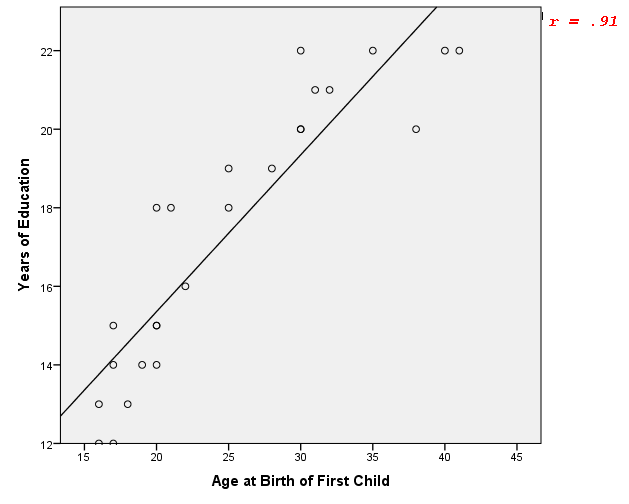
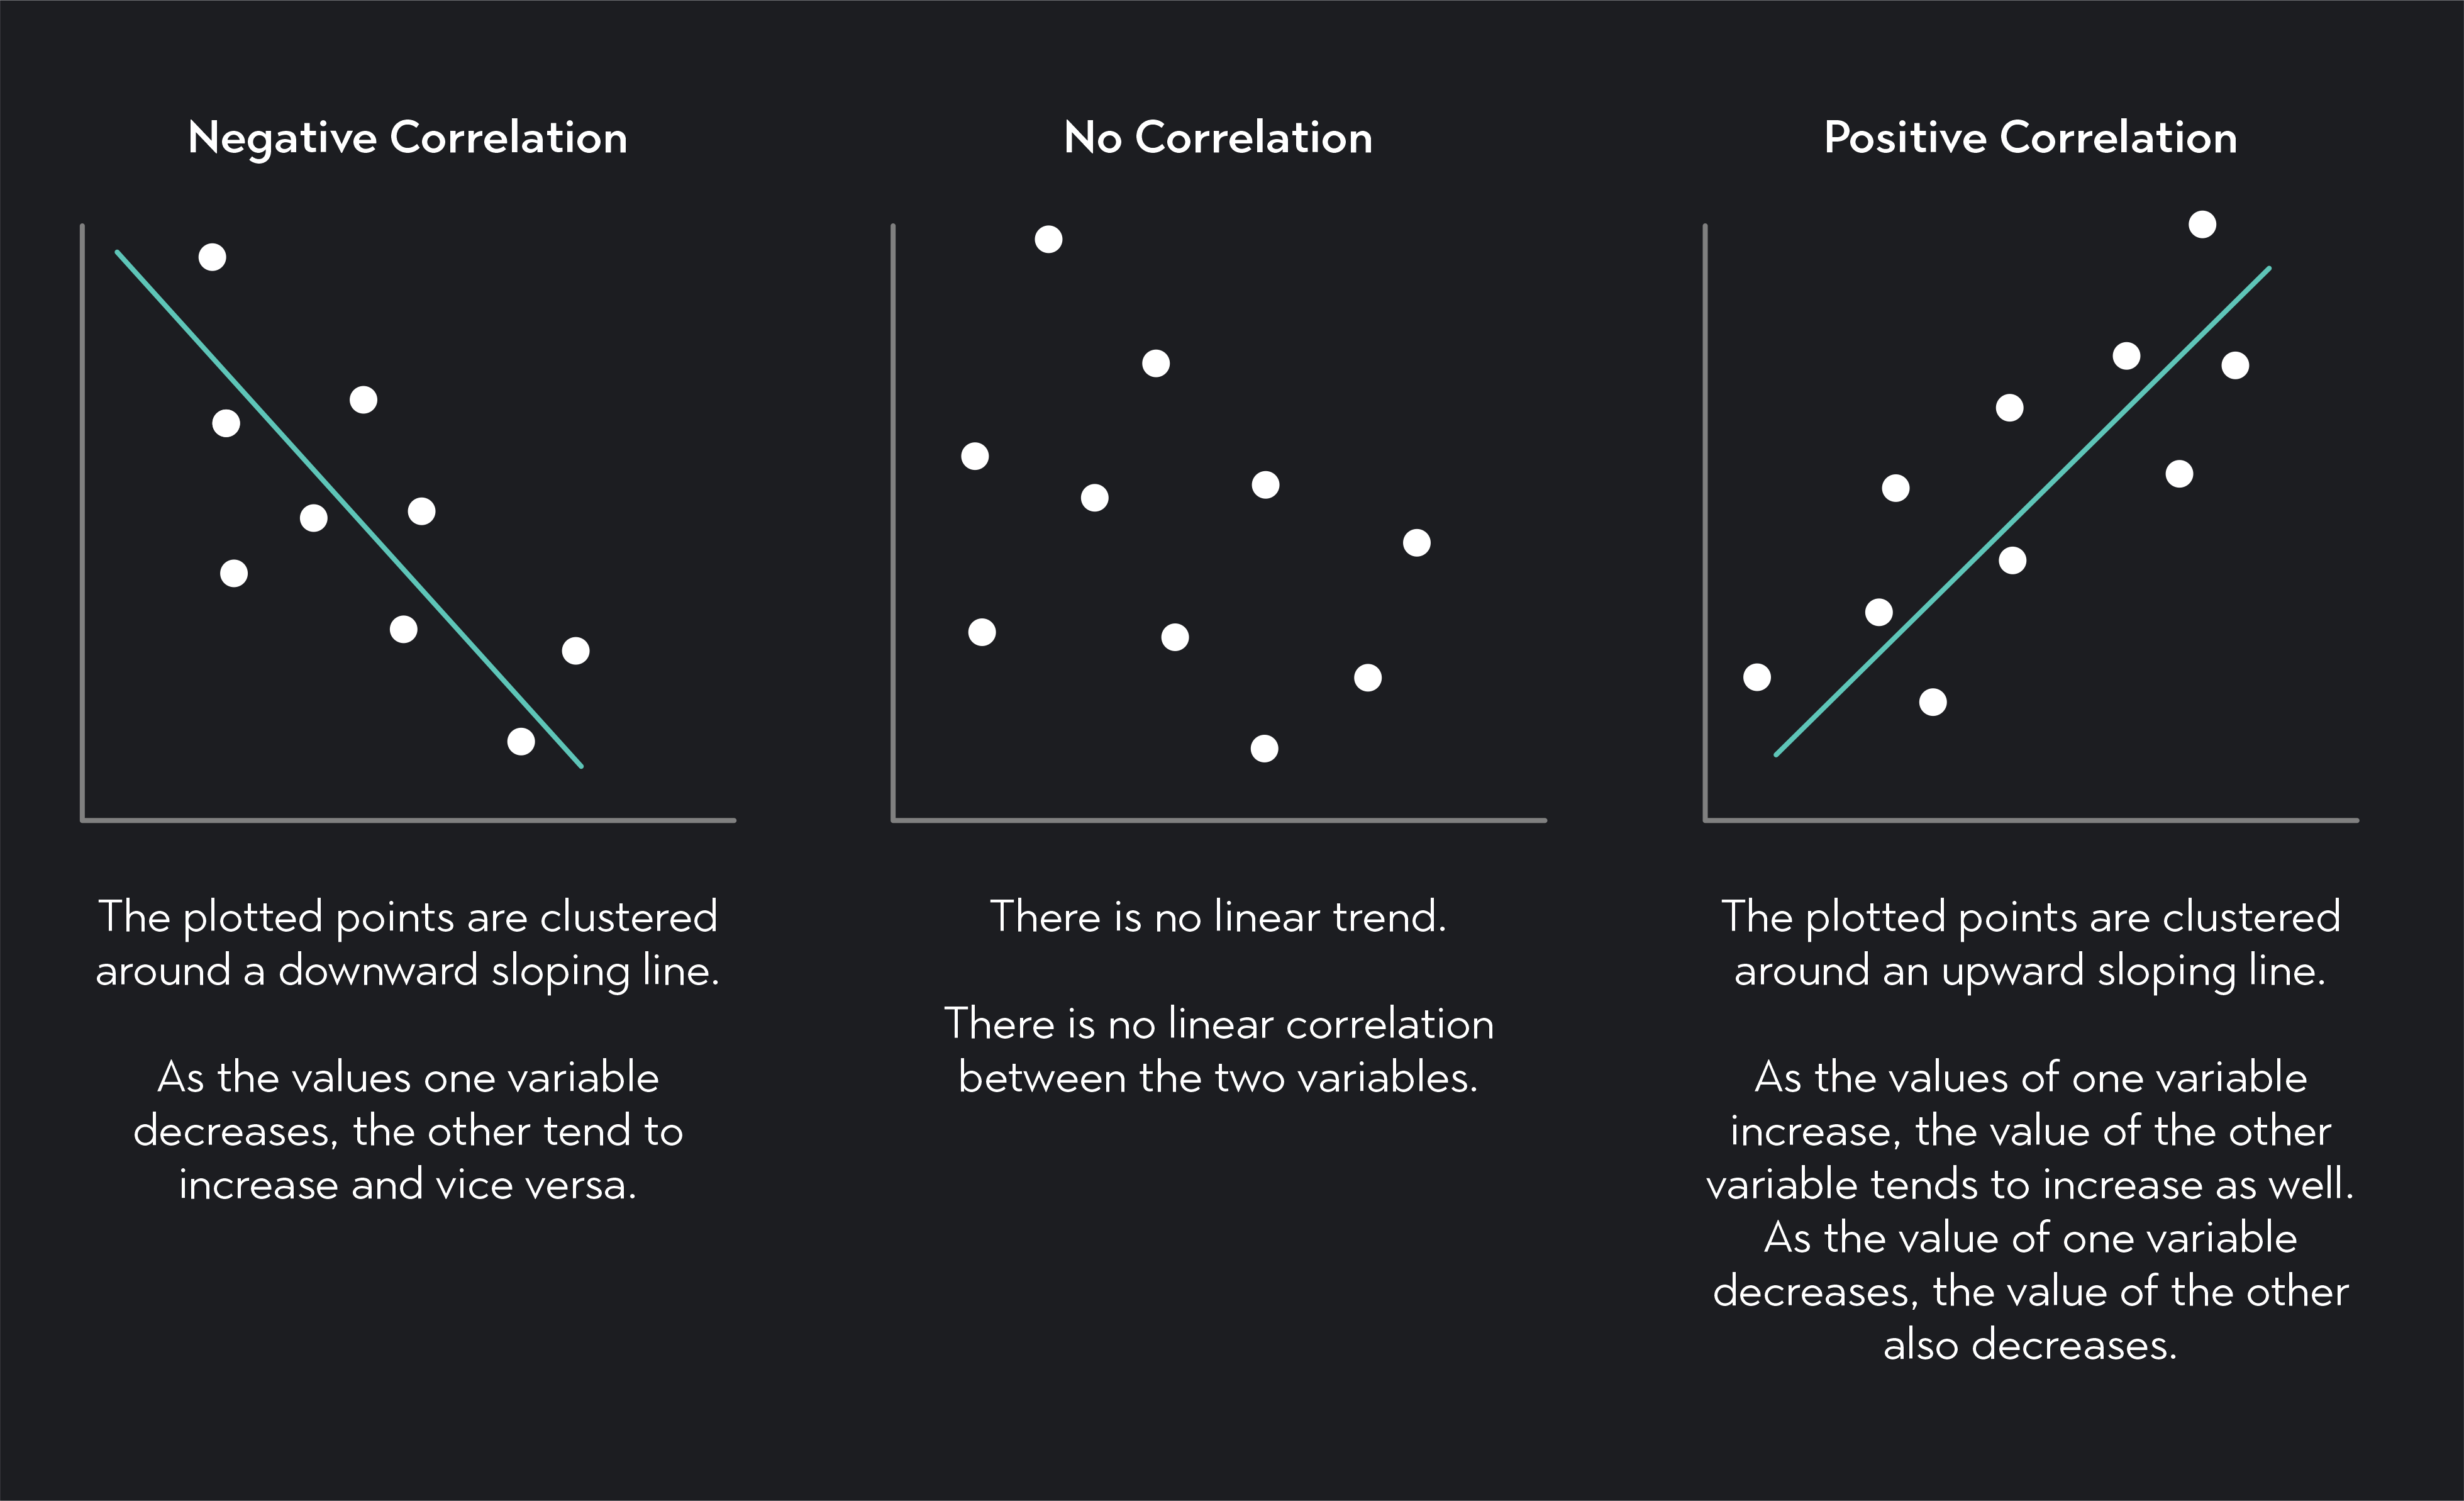
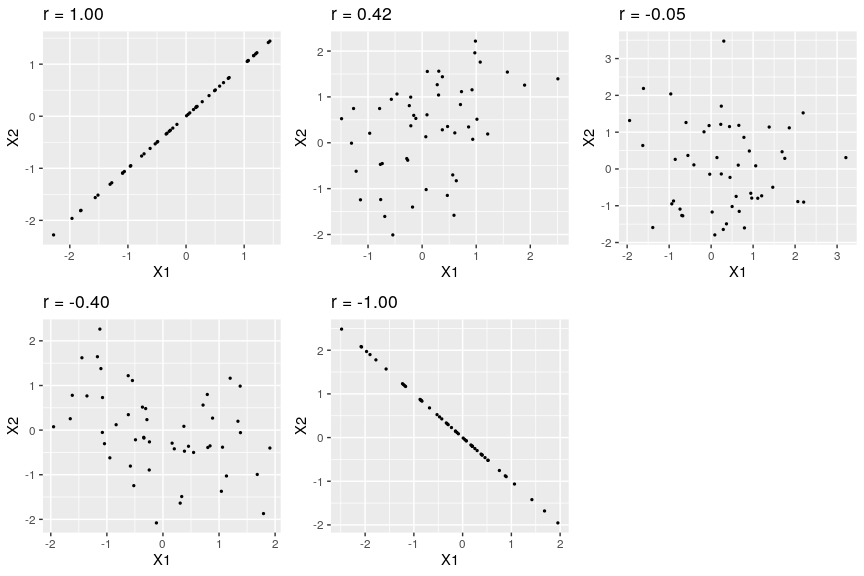
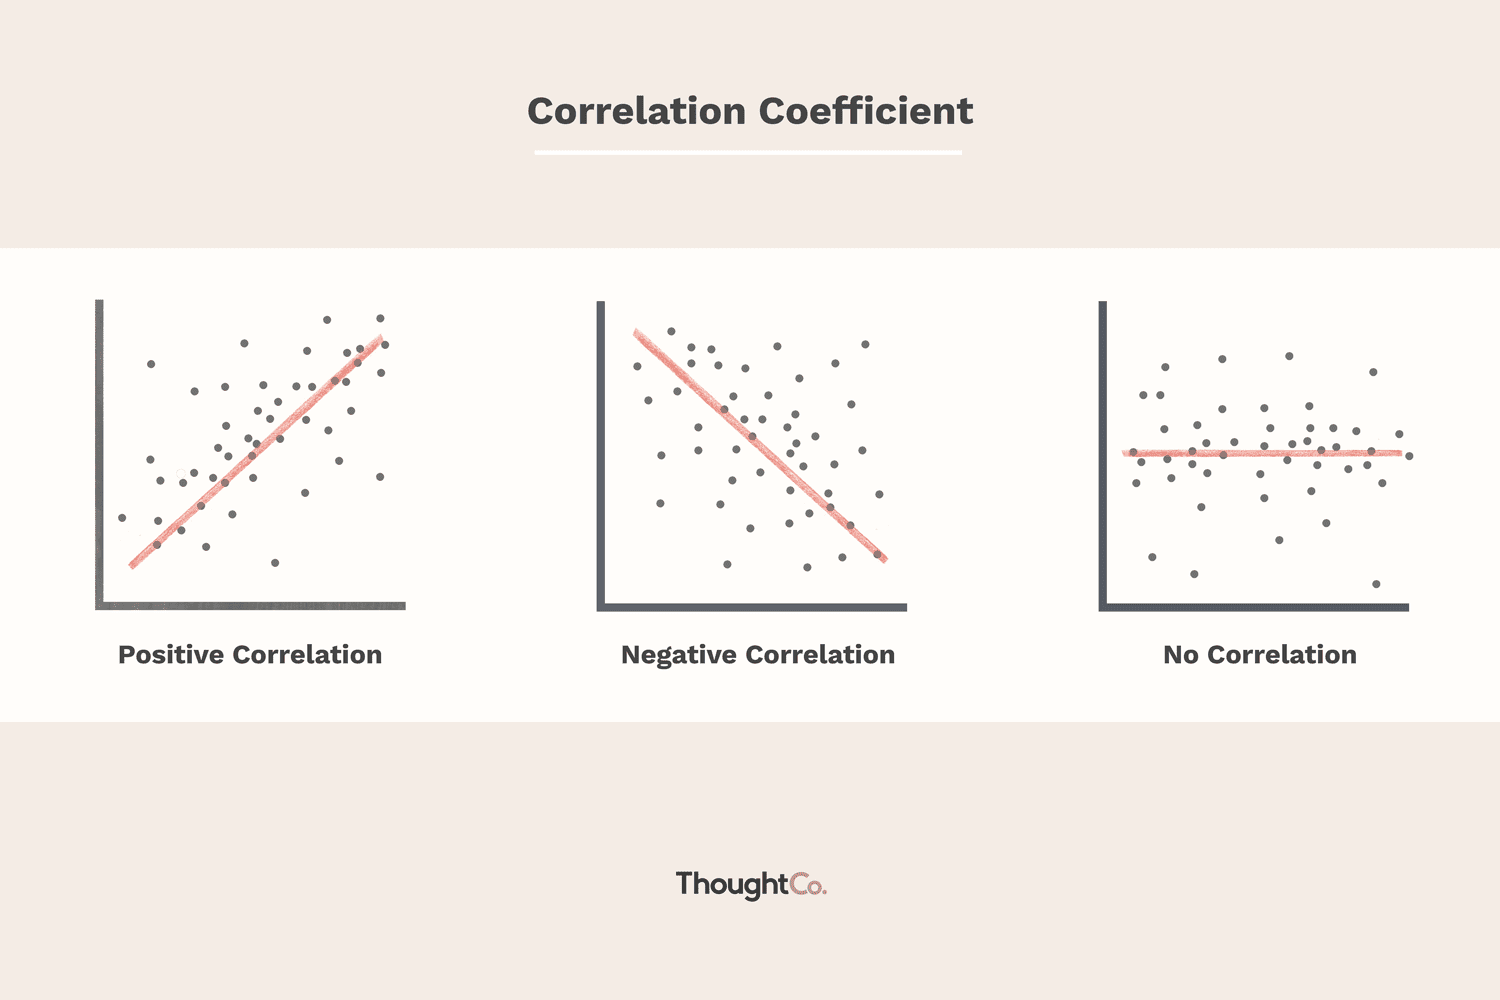
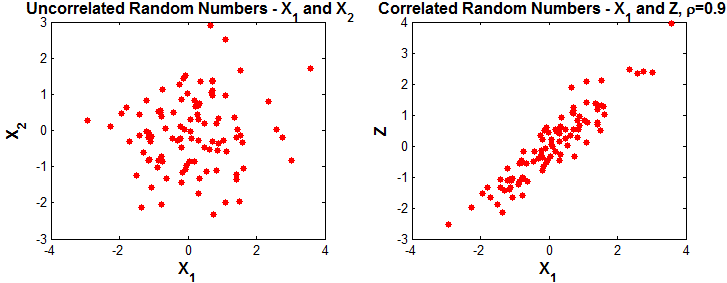
5. Understanding Correlation Using Graphs
Always draw a scatter plot before trusting r.
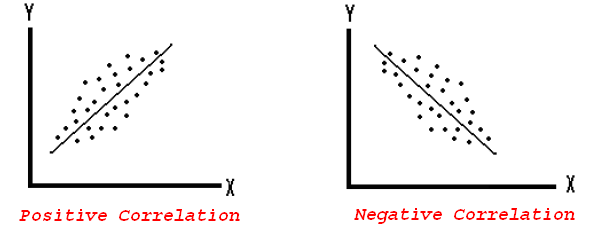
A. Perfect Positive Correlation ( r = +1 )


Example Dataset
| X | Y |
|---|---|
| 1 | 2 |
| 2 | 4 |
| 3 | 6 |
| 4 | 8 |
| 5 | 10 |
Here:

All points lie on one rising line.B. Perfect Negative Correlation ( r = –1 )

Example Dataset
| X | Y |
|---|---|
| 1 | 10 |
| 2 | 8 |
| 3 | 6 |
| 4 | 4 |
| 5 | 2 |
Here:

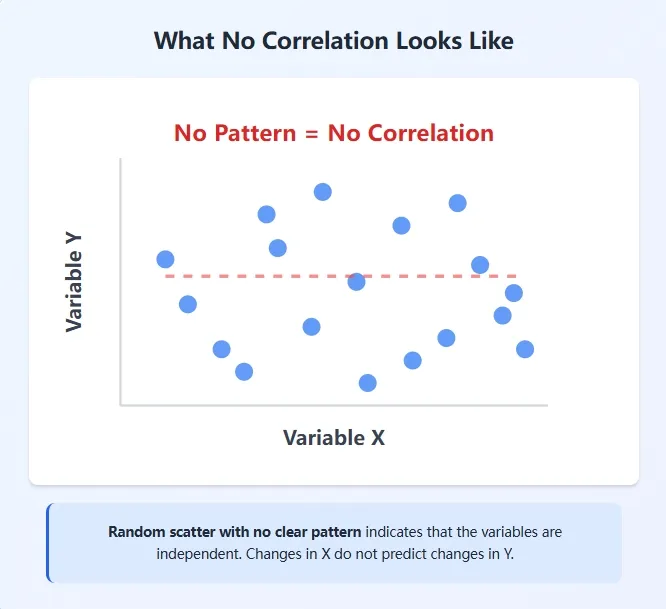
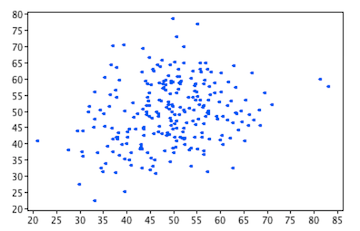
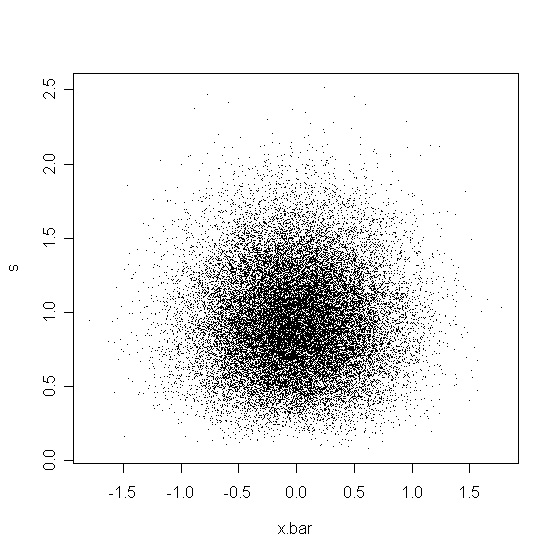
One rises, the other falls.C. No Linear Correlation ( r ≈ 0 )
Example Dataset
| X | Y |
|---|---|
| 1 | 7 |
| 2 | 3 |
| 3 | 9 |
| 4 | 4 |
| 5 | 6 |
Here:

Products cancel → no straight-line pattern.
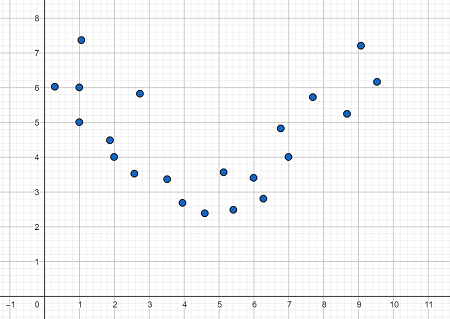
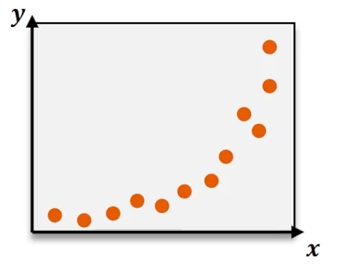
D. Non-Linear Relationship ( Pearson Fails )

Example
| X | Y |
|---|---|
| 1 | 1 |
| 2 | 4 |
| 3 | 9 |
| 4 | 16 |
| 5 | 25 |
Here:

Strong relationship But Pearson → r ≈ 0 Because it is curved.
6. Correlation ≠ Causation
Correlation does NOT mean cause.
Example:
- Ice cream sales ↑
- Drowning ↑
Both caused by summer.
Not by each other.
7. How Finance Professionals Use Correlation
A. Portfolio Diversification
Goal: Reduce risk.
| r Value | Meaning |
|---|---|
| > 0.8 | Risky |
| < 0.3 | Good |
| < 0 | Hedge |
They prefer:
![r<0.3[/latex] <pre class="wp-block-code"><code> </code></pre> <hr class="wp-block-separator has-alpha-channel-opacity"/> <h2 class="wp-block-heading"> B. Stock vs Index</h2> <p>Check:</p> <p>Stock Return vs Market Return</p> <p>High r → market dependent<br>Low r → independent stock</p> <hr class="wp-block-separator has-alpha-channel-opacity"/> <h2 class="wp-block-heading"> C. Banking & Loans</h2> <p>Interest Rate vs Loan Demand</p> <p>Usually:</p> [latex]r<0[/latex] <pre class="wp-block-code"><code> Used for pricing.</code></pre> <hr class="wp-block-separator has-alpha-channel-opacity"/> <h2 class="wp-block-heading"> D. Marketing ROI</h2> <p>Ads vs Sales</p> <p>If:</p> [latex]r>0.7](https://img.gamelinxhub.com/images/latex.php?latex=r%3C0.3%26%2391%3B%2Flatex%26%2393%3B++++%3Cpre+class%3D%22wp-block-code%22%3E%3Ccode%3E+%3C%2Fcode%3E%3C%2Fpre%3E++++%3Chr+class%3D%22wp-block-separator+has-alpha-channel-opacity%22%2F%3E++++%3Ch2+class%3D%22wp-block-heading%22%3E%F0%9F%93%8A+B.+Stock+vs+Index%3C%2Fh2%3E++++%3Cp%3ECheck%3A%3C%2Fp%3E++++%3Cp%3EStock+Return+vs+Market+Return%3C%2Fp%3E++++%3Cp%3EHigh+r+%E2%86%92+market+dependent%3Cbr%3ELow+r+%E2%86%92+independent+stock%3C%2Fp%3E++++%3Chr+class%3D%22wp-block-separator+has-alpha-channel-opacity%22%2F%3E++++%3Ch2+class%3D%22wp-block-heading%22%3E%F0%9F%92%B3+C.+Banking+%26+Loans%3C%2Fh2%3E++++%3Cp%3EInterest+Rate+vs+Loan+Demand%3C%2Fp%3E++++%3Cp%3EUsually%3A%3C%2Fp%3E+++%5Blatex%5Dr%3C0%26%2391%3B%2Flatex%26%2393%3B++++%3Cpre+class%3D%22wp-block-code%22%3E%3Ccode%3E+Used+for+pricing.%3C%2Fcode%3E%3C%2Fpre%3E++++%3Chr+class%3D%22wp-block-separator+has-alpha-channel-opacity%22%2F%3E++++%3Ch2+class%3D%22wp-block-heading%22%3E%F0%9F%93%A2+D.+Marketing+ROI%3C%2Fh2%3E++++%3Cp%3EAds+vs+Sales%3C%2Fp%3E++++%3Cp%3EIf%3A%3C%2Fp%3E+++%5Blatex%5Dr%3E0.7&bg=ffffff&fg=000&s=0&c=20201002)
Campaign works.8. How Professionals Decide “No Relationship”
They NEVER trust r alone.
They check:
r < 0.2
p-value > 0.05
Scatter plot
Stability over time
Business logic
Only then:
“Probably independent.”
9. When NOT to Use Pearson
Do NOT use Pearson when:
Data is curved
Data is ranked
Data has outliers
Regimes change
Use instead:
- Spearman
- Regression
- Nonlinear models
10. Step-by-Step Method for Learners
Before using Pearson, always follow this:
Step 1
Plot X vs Y
Step 2
Ask: “Is it roughly straight?”
Step 3
If yes → Use Pearson
Step 4
Compute r
Step 5
Check if r > 0.3
Step 6
Interpret with business logic
Final Summary
| Topic | Key Idea |
|---|---|
| Pearson Measures | Linear relationship |
| r ≈ 0 Means | No straight-line pattern |
| Not Meaning | No relationship at all |
| Always Do | Plot first |
| Finance Use | Risk control |
Final Takeaway
Pearson correlation tells you how well two variables move together in a straight line. A value near zero means no strong linear pattern, not necessarily no relationship.